PER-STATION RESOLUTION
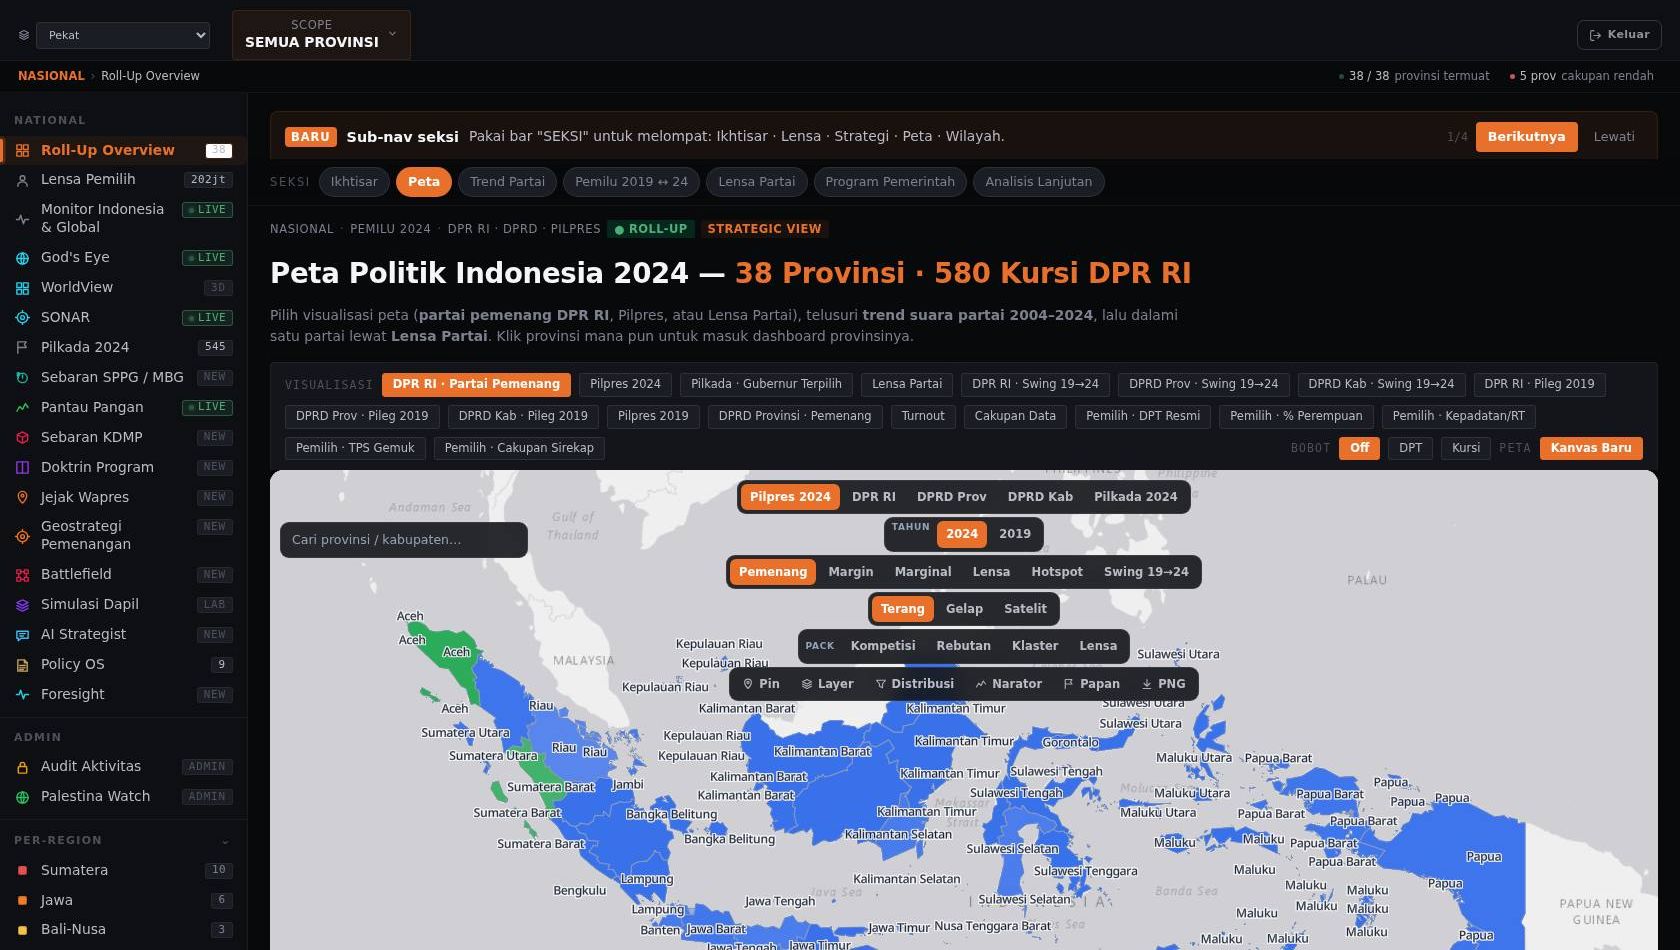
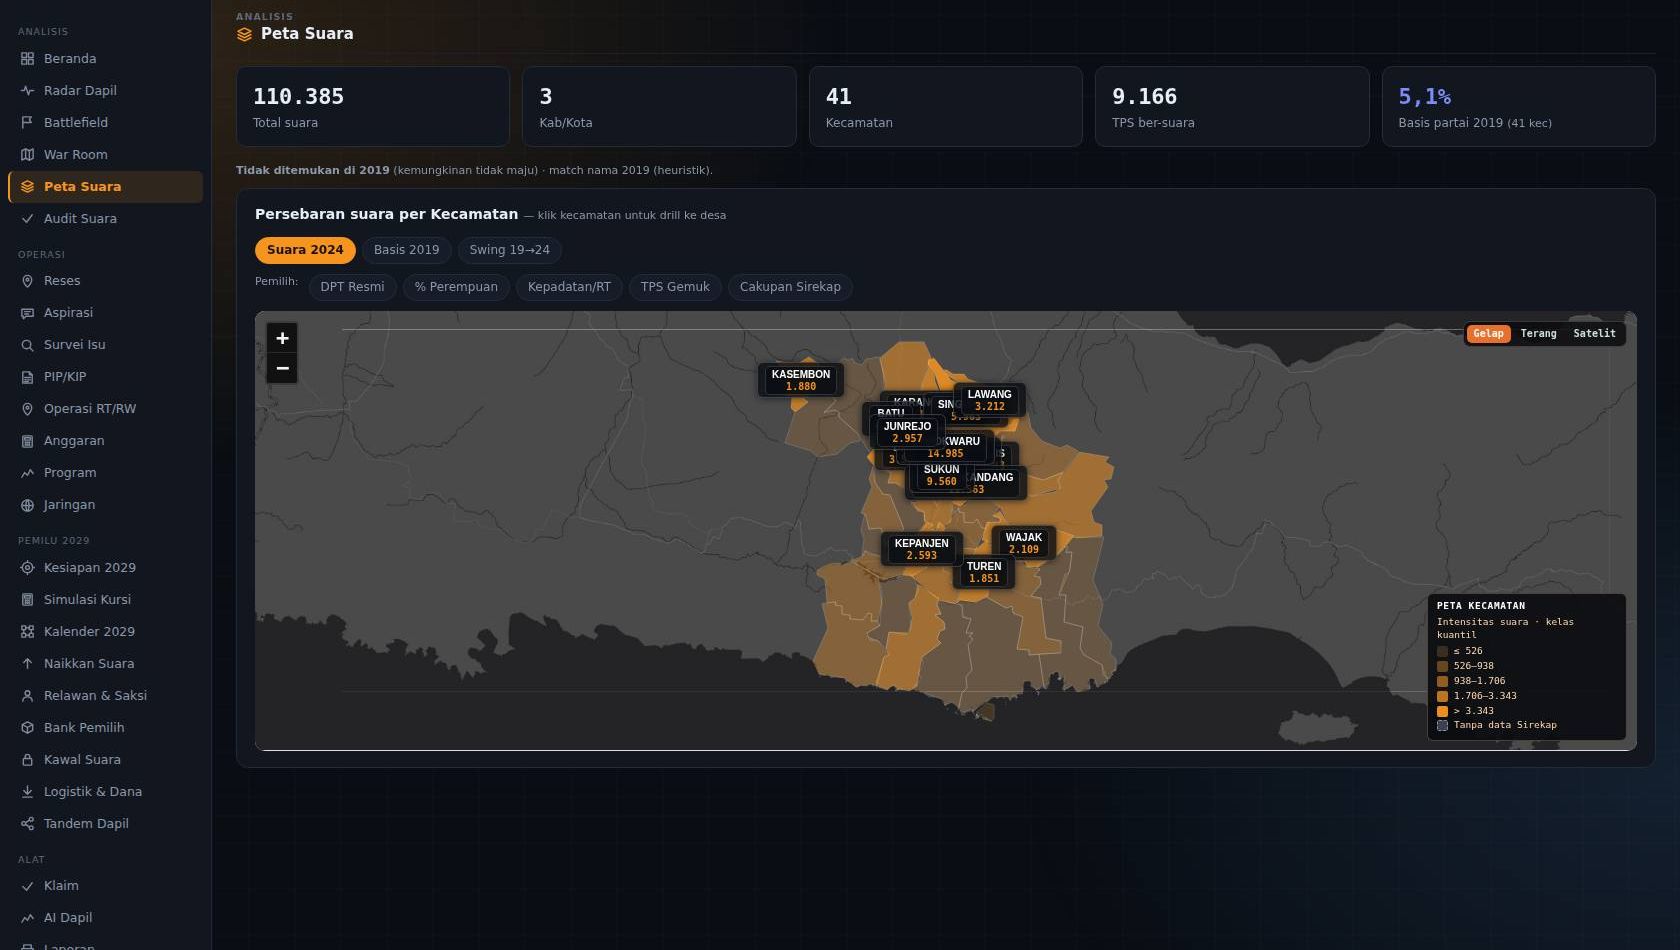
Every national number decomposes on demand — 38 provinces, 84 districts, 91,948 administrative units, 823,378 polling stations. The map drills from the archipelago to a single ballot box.
Syntrichia 1.0 — Intelligence for Policy, Politics, and Society. Read the platform overview
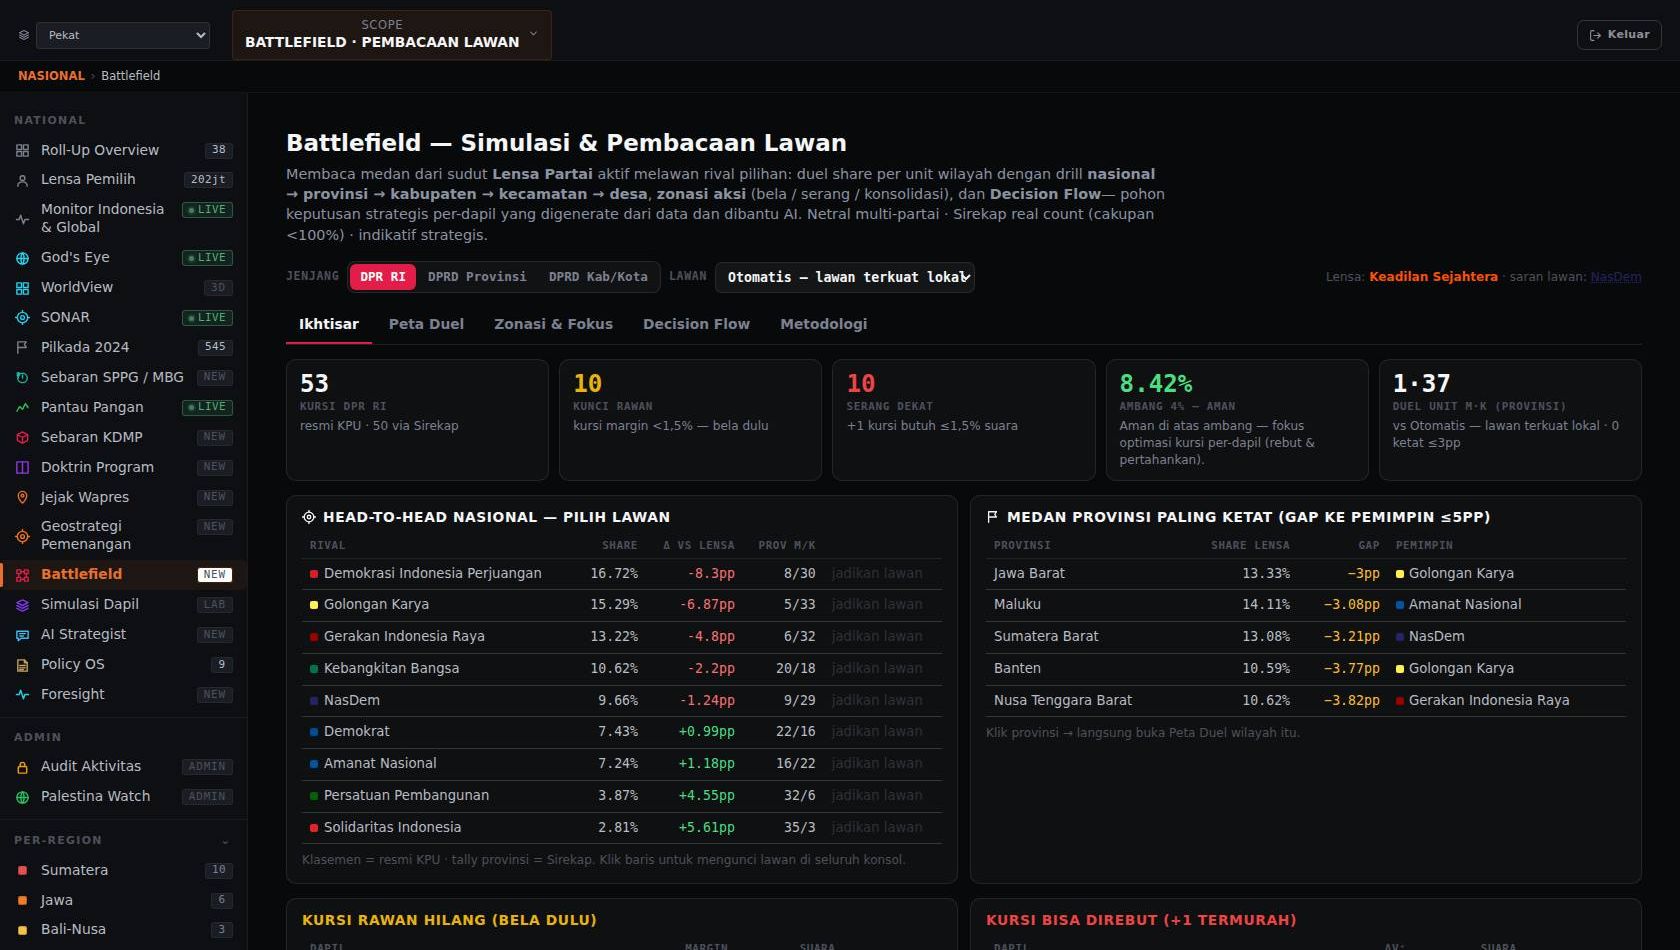
CAPTURED LIVE FROM THE PLATFORM · PARTY LENS — every surface can be re-focused through any of Indonesia's 18 parliamentary parties.
Sirekap/KPU real-count data. Coverage below 100% reflects stations not yet uploaded.
Our Software
Electoral intelligence for 38 provinces, resolved to all 823,378 polling stations
Loads every 2024 and 2019 result down to the polling station — 823,378 stations, 202 million registered voters resolved to RT/RW — and anchors it to the official 580-seat allocation. Swing between cycles, candidate history, party share, and constituency simulations are computed automatically for every province, district, and village.
A strategist sees in seconds where a seat was won or lost, by how many votes and at which stations, and which villages moved between cycles — without opening a single spreadsheet.
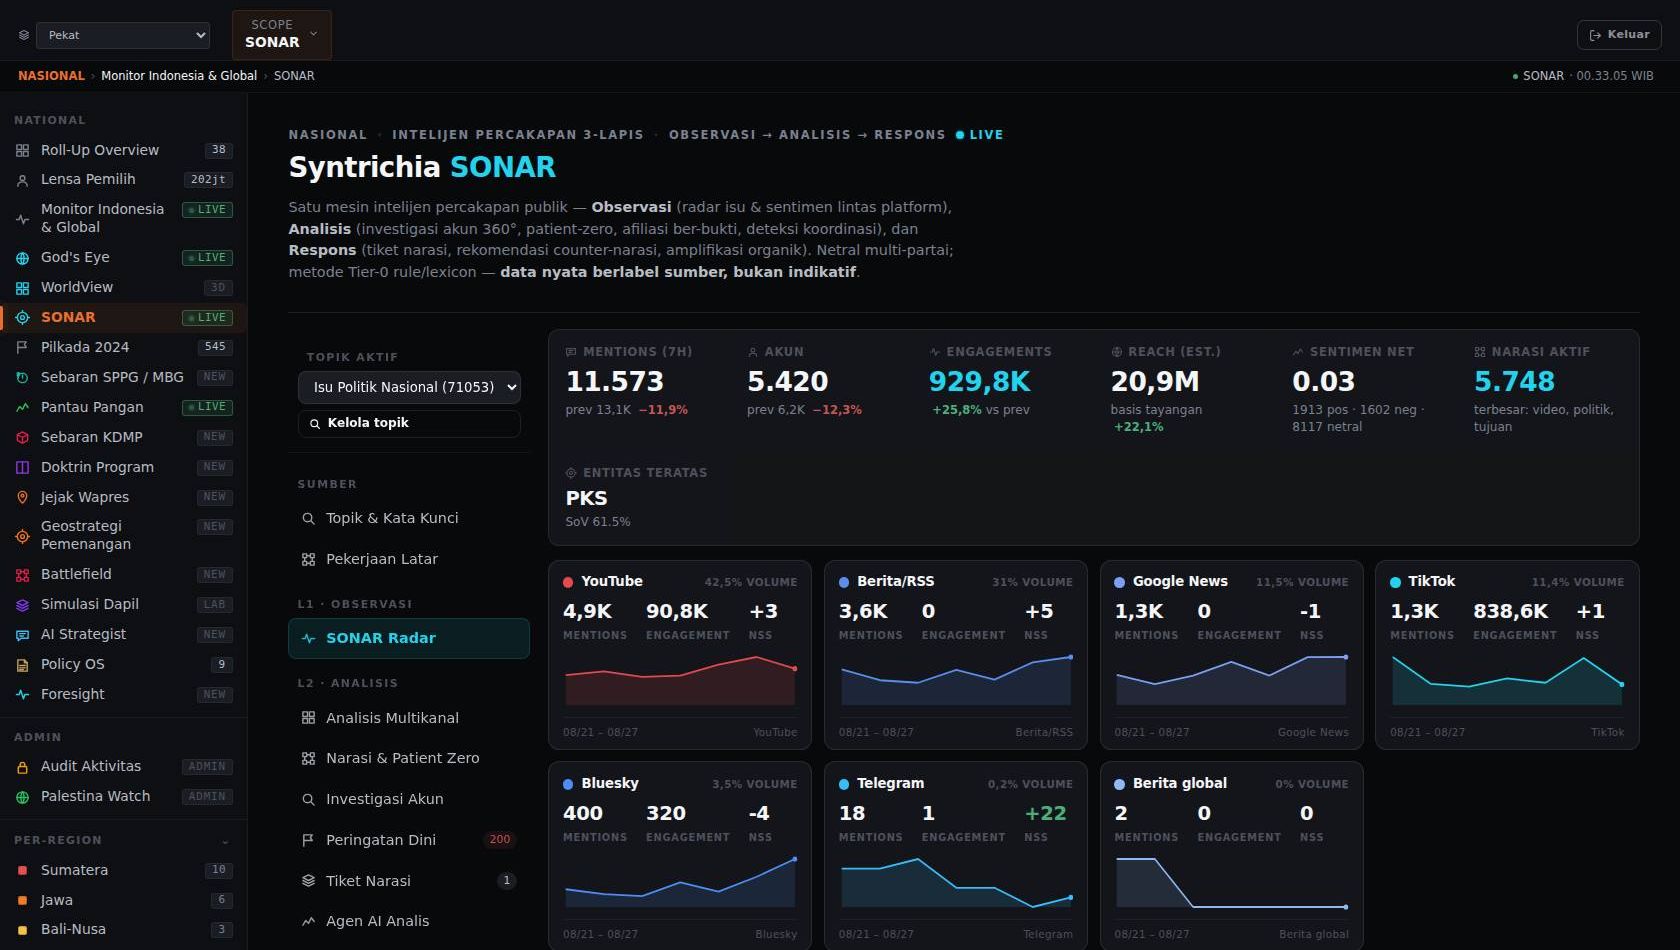
Track narratives, networks, and sentiment across the Indonesian information space
Continuously ingests video platforms, short-video, public social posts, messaging channels, and the national newswire. AI clusters the conversation into narratives, maps the account networks amplifying each one, and scores sentiment per issue and per party. A keyword engine expands the tracking terms on its own as language shifts.
Shows who is shaping a narrative, how fast it spreads, and the moment it turns hostile — hours before it reaches the front page, so a response is prepared rather than improvised.
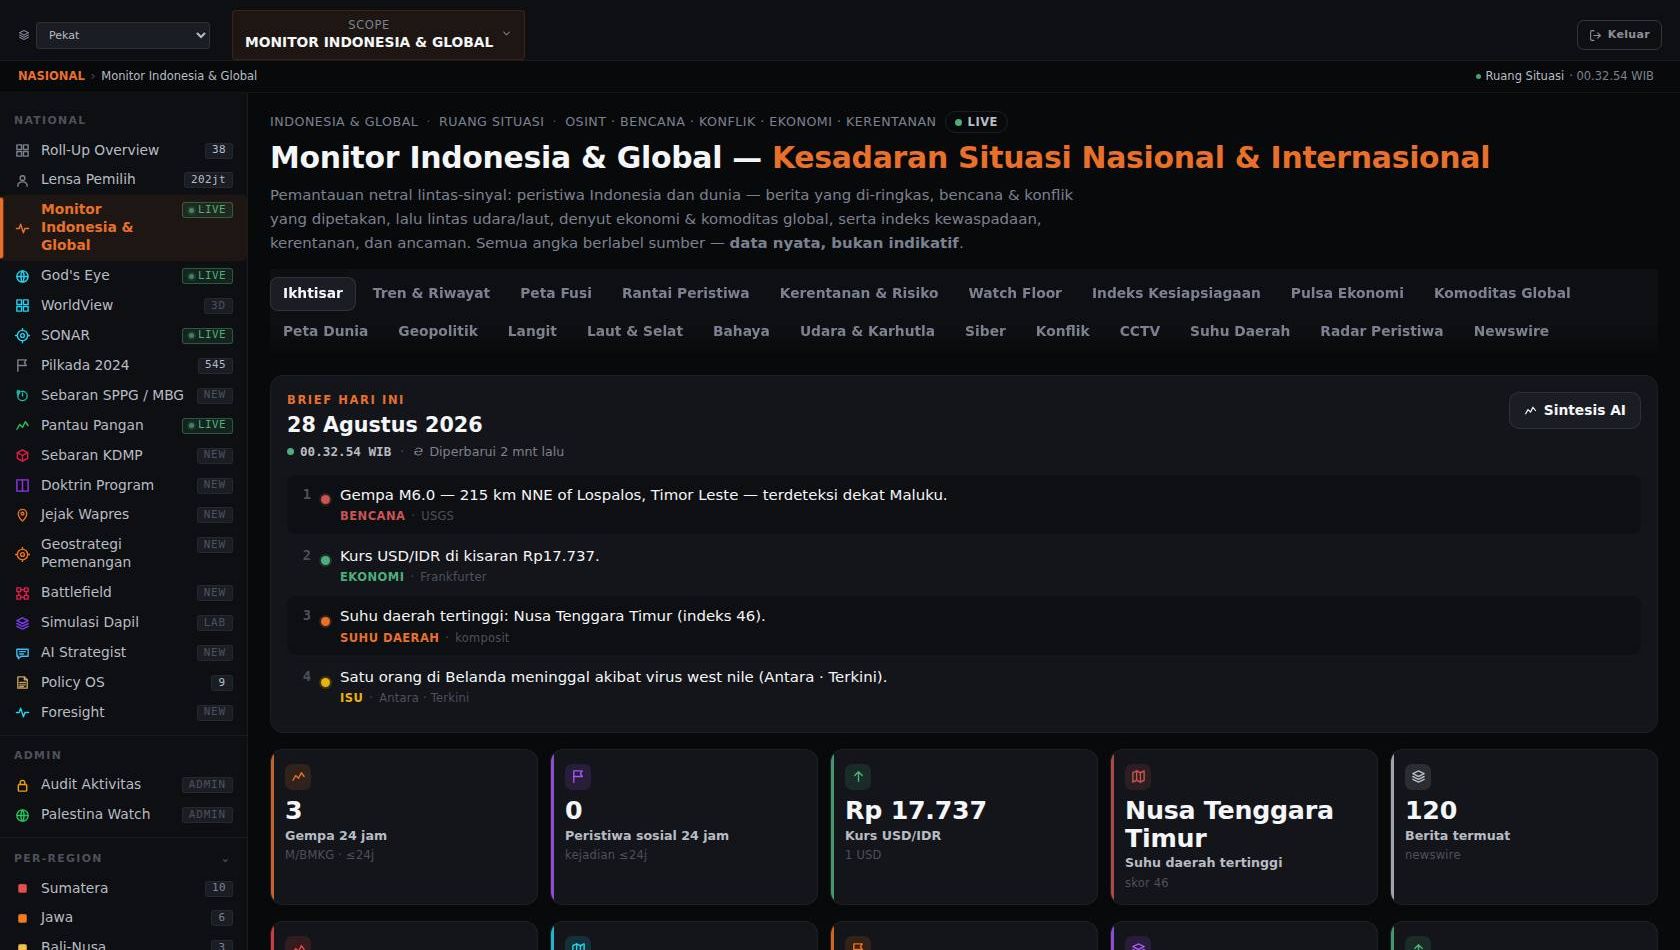
A national situation room — hazards, markets, security, and media in real time
Fuses earthquakes, active fires, floods, air quality, 7,118 traffic cameras, live aircraft and vessel positions, 27 market instruments, and 61 geopolitical channels into one picture refreshed every 30 minutes. Every metric is archived as a time series, and an AI chain-of-events links related incidents into a single storyline automatically.
One screen replaces a dozen agency dashboards. Decision-makers see a disruption as it forms — not in tomorrow’s report — and can trace how it developed.
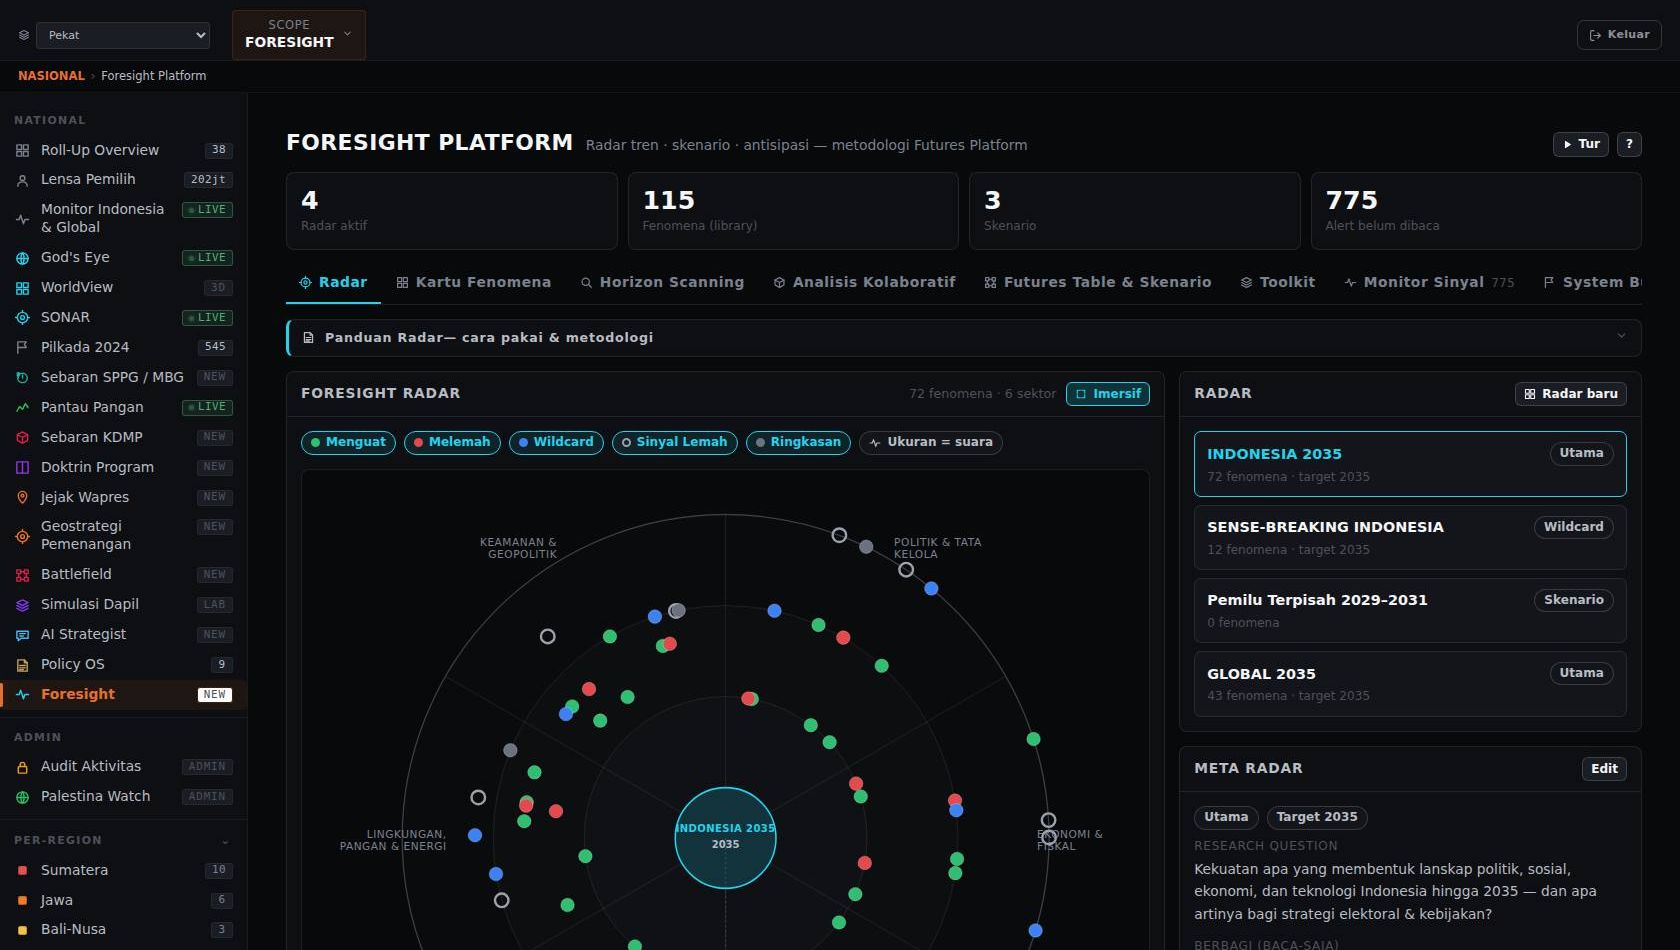
Scan horizons, map phenomena, and rehearse scenarios before they arrive
Scans weak signals from the whole platform — media, hazards, markets, and politics — and ranks them on a horizon radar by strength and trajectory. Emerging phenomena are geolocated on the map automatically, and a team can rehearse scenarios against the platform’s own data as evidence.
Turns scattered signals into an ordered watchlist. The organisation prepares for a shock in advance instead of explaining it afterwards.
Command the terrain from the national map down to a single village
One continuous drill path from the archipelago to a single village, with per-station results at every step. Candidate duels are computed per sub-district, and a penetration index and terrain posture classify every area automatically as stronghold, contested, or open ground.
Field teams receive an ordered list of where to send people and money — and where not to — instead of debating it from memory.
Run a constituency — voters, canvassing, service, and election-day defense
A complete operating system for a constituency: a voter bank tied to the registry, canvassing and surveys that update issue maps by village automatically, aid-programme matrices, service calendar, logistics, and an election-day guard with witness reporting and scanned-form audit. A mobile app for field officers works offline and reads ID cards by camera.
A legislator’s team runs the whole term — constituent service, recess visits, and re-election — in one system instead of chat groups and spreadsheets, and sees at a glance which strategic areas are still untouched.
Food-security intelligence, from paddy fields to global grain flows
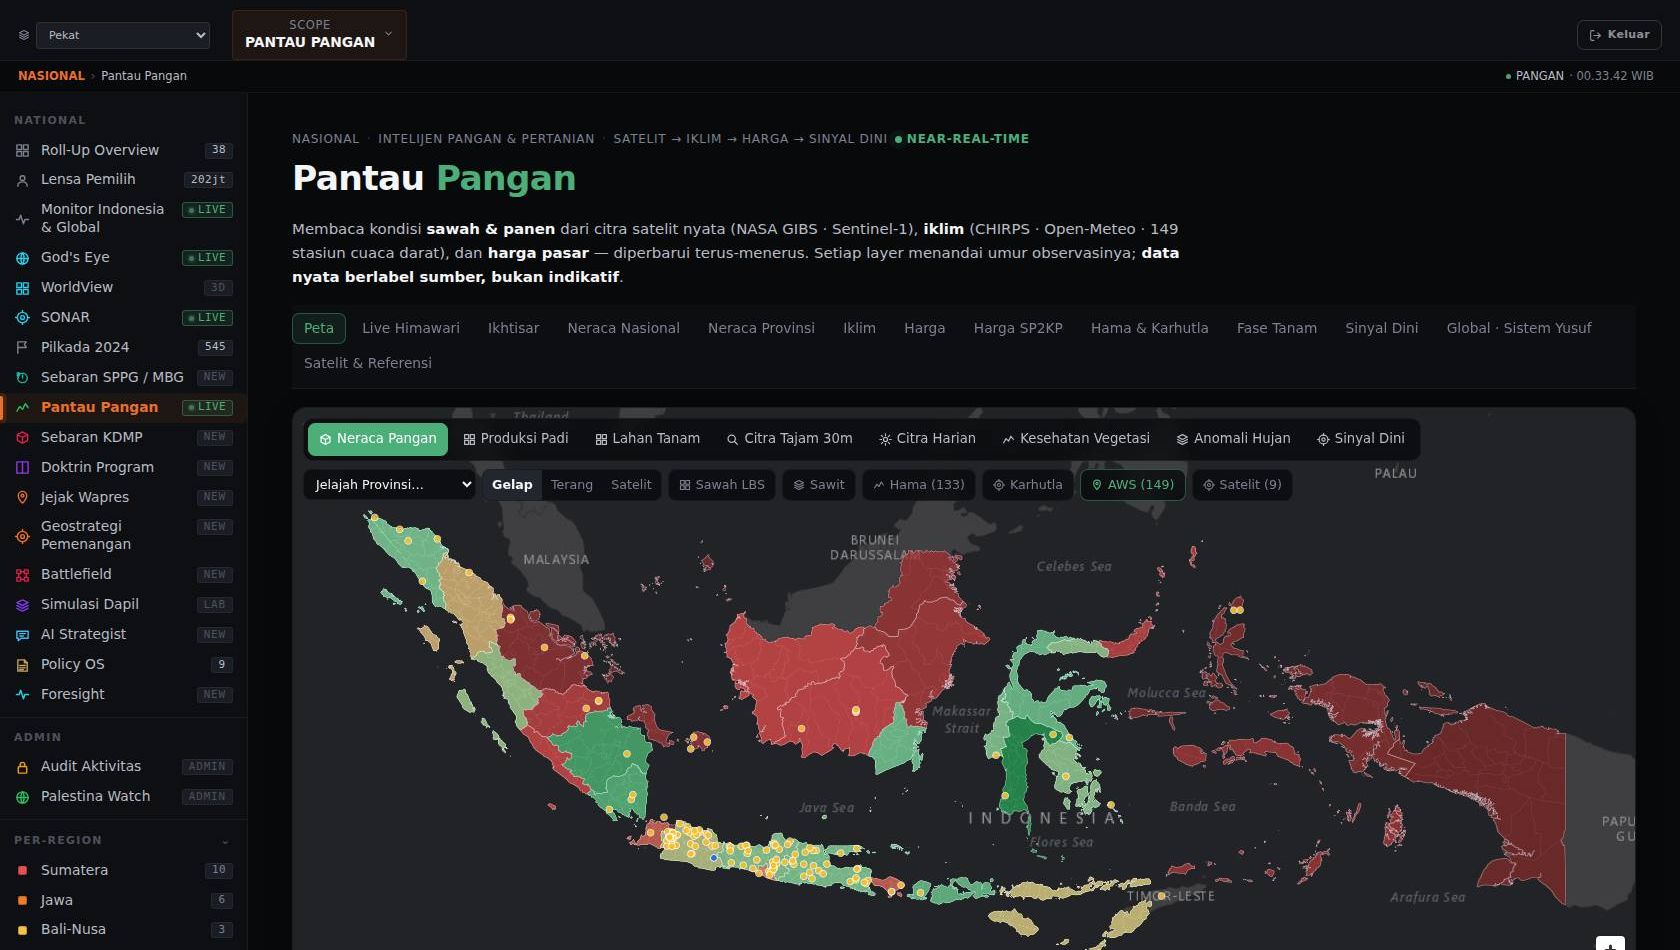
Builds the national food picture daily: prices resolved to individual markets against the ceiling price, the national balance sheet of production, trade, and stocks, and orbital reads — vegetation index, cloud-penetrating radar, and rainfall — that show the planting phase on paddy land. Global grain stocks and shipping-chokepoint pressure complete the frame, and divergence alerts fire automatically where prices and supply disagree.
A price shock or a failed planting season is detected weeks ahead, by province and by market — early enough to move stocks and policy rather than react.
An agentic AI that reads the whole platform — and argues back
An agent wired to every module: it queries the electoral, media, hazard, and food data itself, cites the figures it used, and builds a position — neutral by default, partisan when a party lens is active. Each answer is a chain of evidence the team can inspect and challenge.
A grounded strategy memo in minutes instead of days, and a second opinion that pushes back on assumptions before they reach the war room.
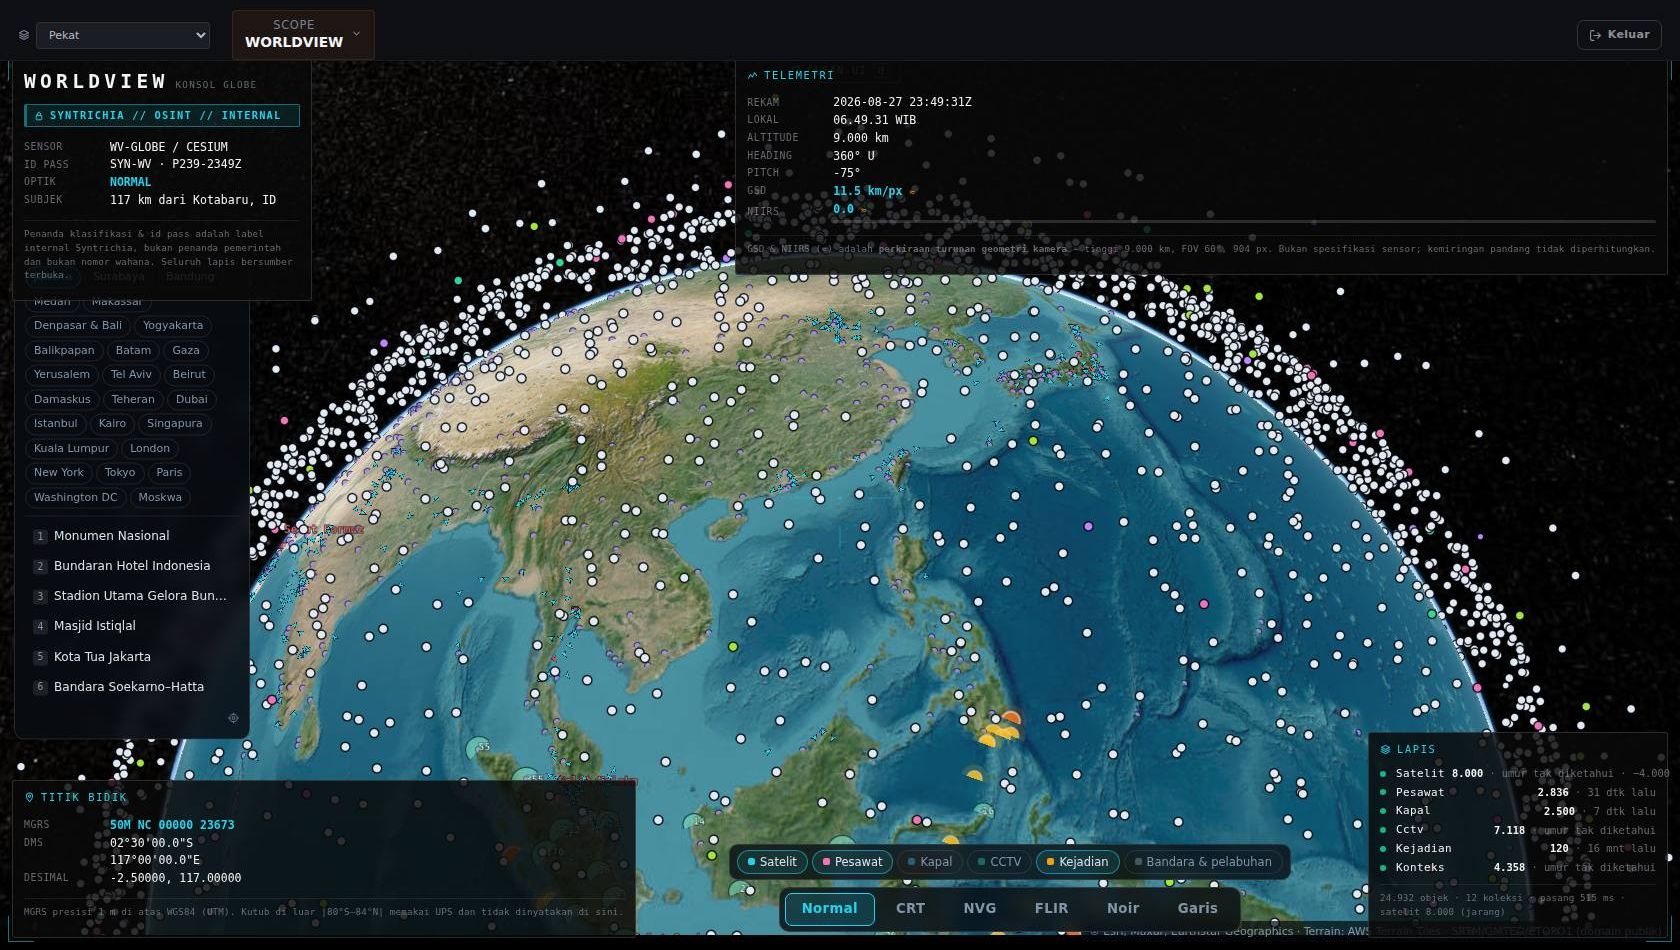
A 3-D command globe over 12,000 satellites in live orbit — night and thermal sensor views
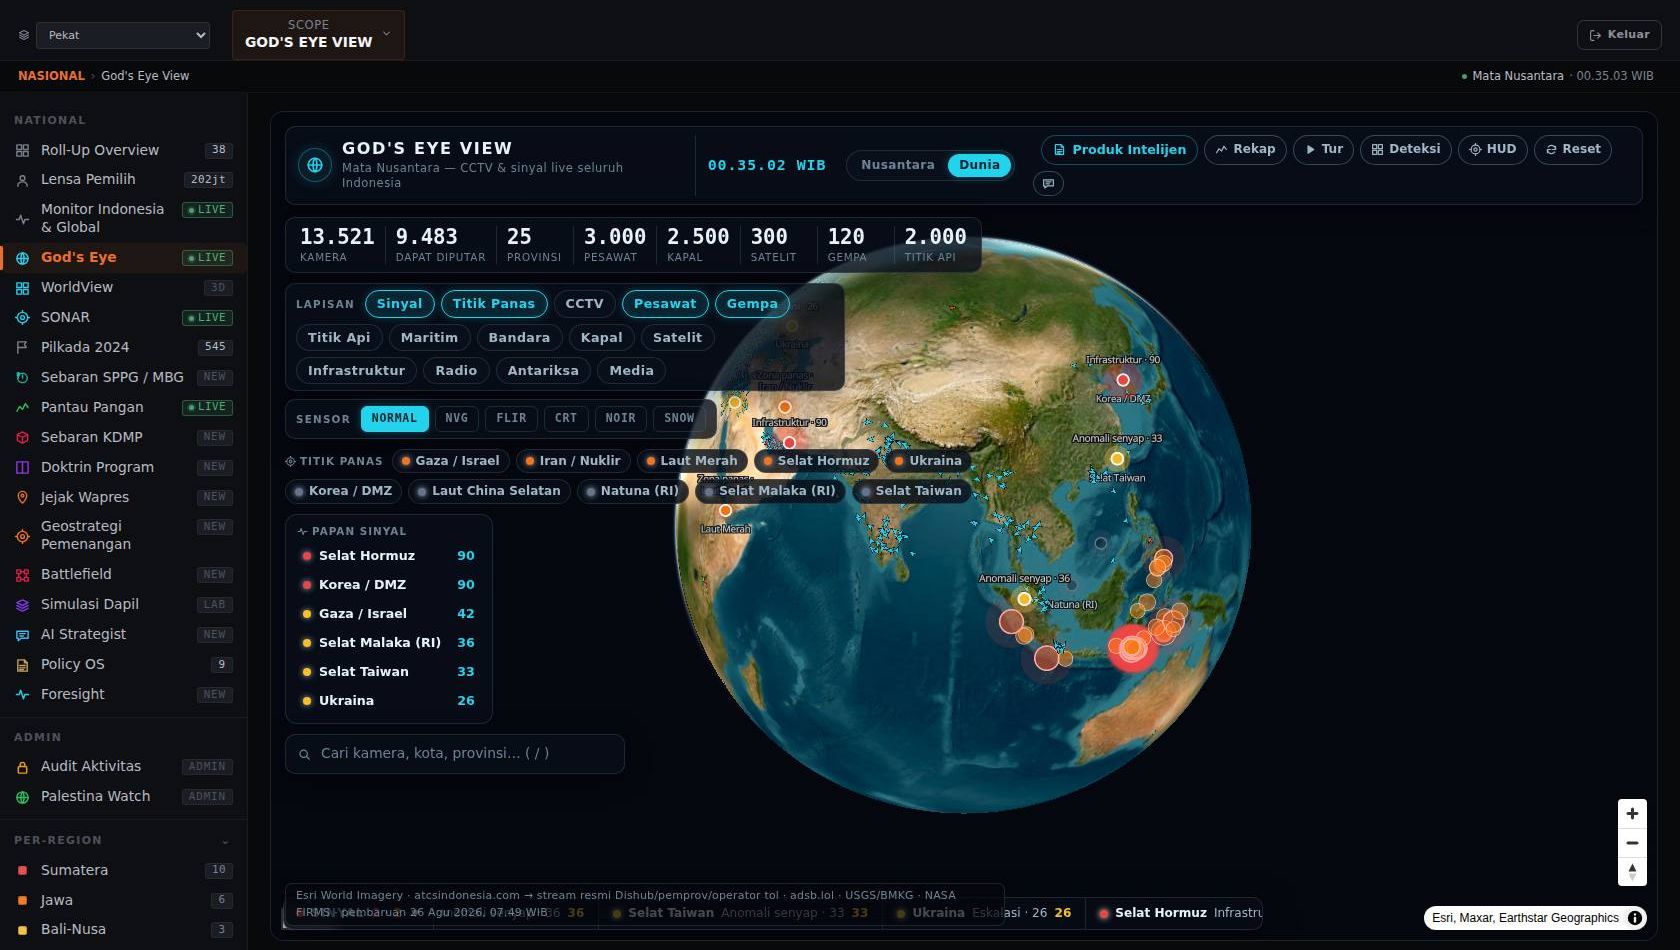
A 3-D globe that propagates 12,000 satellites live from a 16,181-object catalogue — each position recomputed in the browser, accurate to 1–3 km — with night-vision and thermal sensor modes, thousands of camera feeds, and country dossiers on the same surface.
Situational awareness of what is overhead, where, and when — for any point on the planet, on one screen.
Our Data
Nothing here is illustrative. The platform reads official election records, government statistics, orbital sensors, and open signal feeds — and every number can be drilled back to the row it came from.
How to read the numbers: 16,181 is every object in the public orbital catalogue. 12,000 of them are propagated live on the WorldView globe — each position recomputed in the browser from its orbital elements, accurate to 1–3 km. Nine satellites deliver the data products above. Three further fire-detection sensors are read as products only, without orbit tracking.
OFFICIAL AND PUBLIC RECORDS ONLY · When a feed is rate-limited or down, the platform serves the last good snapshot — and says so on the surface that uses it.
Syntrichia is built in Indonesia, for Indonesia's decisions — elections, food, public safety, and policy. One platform, from the national war room to the village.
LEARN MOREEvery national number decomposes on demand — 38 provinces, 84 districts, 91,948 administrative units, 823,378 polling stations. The map drills from the archipelago to a single ballot box.
The system propagates 12,000 satellites in live orbit from a 16,181-object catalogue, alongside NASA, Sentinel, and Himawari imagery read daily for vegetation, rainfall, and burn scars.
Earthquakes, fires, aircraft, vessels, cyber outages, markets, and the newswire — dozens of open sources fused into one situation picture, refreshed around the clock.
Tens of thousands of posts and articles a week, clustered into narratives with sentiment, account networks, and early-warning signals — across news, video, and social platforms.
An AI strategist grounded in the platform’s own numbers — it drafts the brief, cites its evidence pack, and states plainly what the data cannot support.
One neutral data core. Every dashboard re-focuses through any of the 18 parliamentary parties in a single click — the same instrument, any side of the table.